Dashboard
The Dashboard is the landing page after you sign in. It is a live status surface: the cards refresh automatically so cluster health, drain state, and site counts stay current without a manual reload. A greeting at the top welcomes you by your account name.
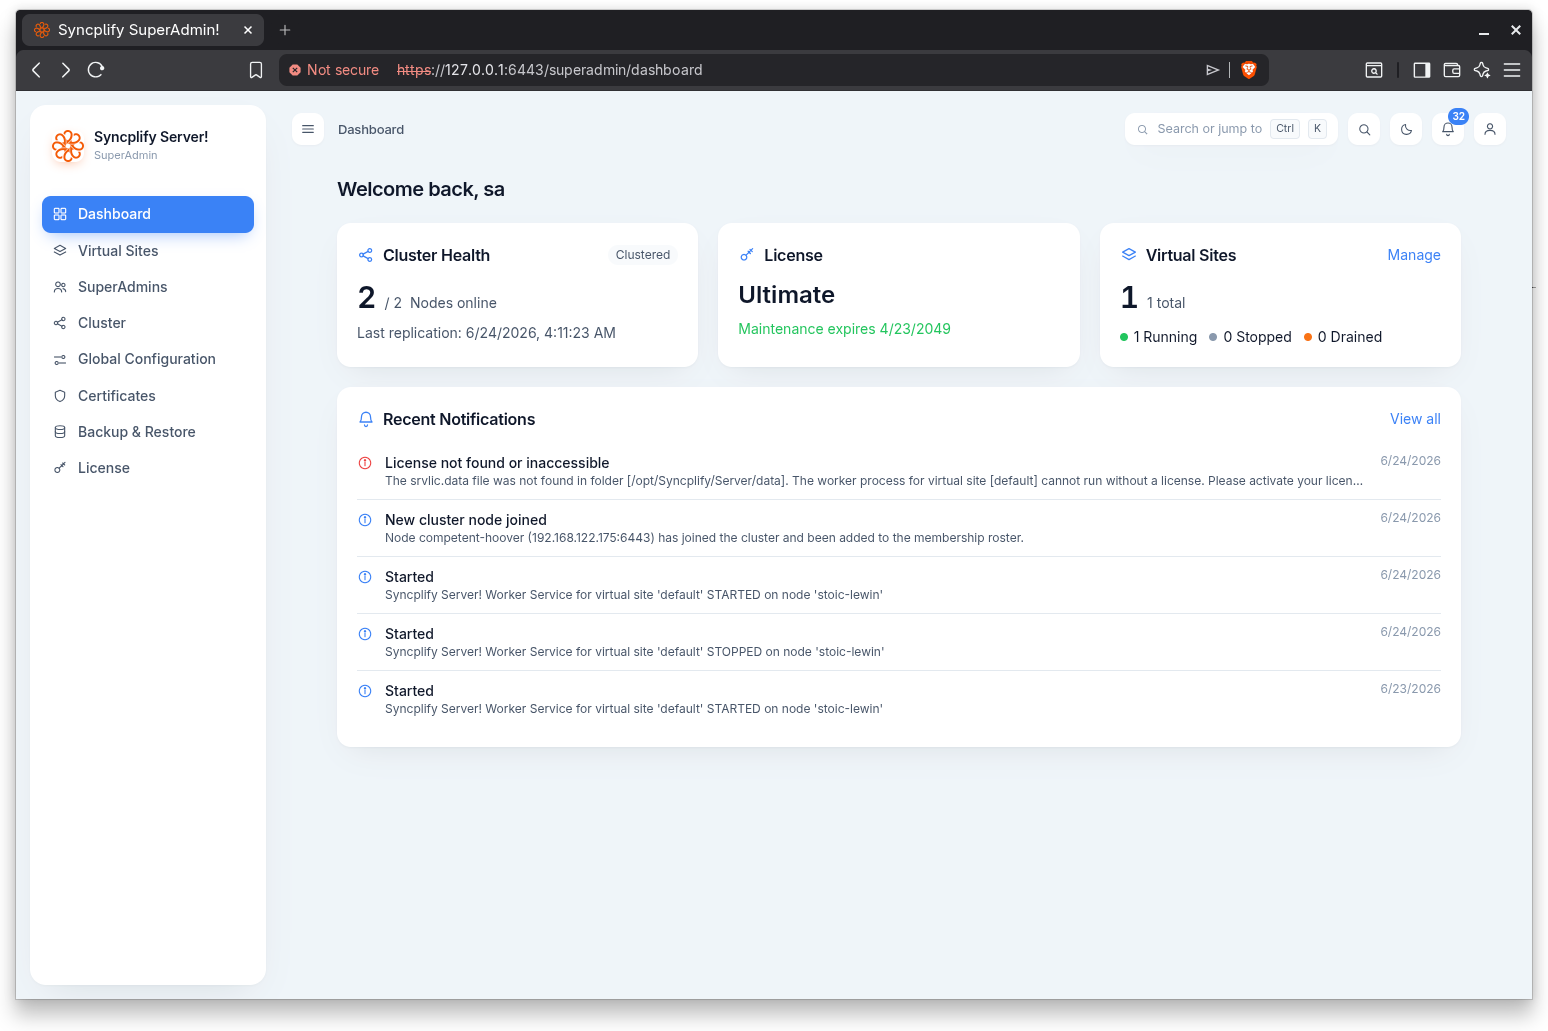
Cluster or node health
The first card adapts to your deployment.
- In a high availability cluster it shows the number of nodes online out of the total, and flags a degraded state when nodes are offline or a draining state when one or more nodes are draining. When available, it also shows the time of the last replication cycle.
- On a standalone server it shows this node by name with an Online indicator and the running version.
License
The License card shows the current edition. When a maintenance date is known, it shows when maintenance expires, and changes color as the date approaches: a neutral note while comfortable, a warning within about fifteen days, and a danger note once expired.
Virtual Sites
The Virtual Sites card shows the total number of virtual sites and a breakdown of how many are running, stopped, and draining. A Manage link jumps to the Virtual Sites area.
Recent Notifications
The last few notifications are listed with a severity color (information, warning, or error), title, and date. A View all link opens the full Notifications page.