The Dashboard
As soon as you log into the Admin UI, you're welcomed by the dashboard, which provides both real-time and historical overviews of your Syncplify Server!'s operation.
The dashboard is divided into four main sections:
Real-Time View
This is the main (and default) dashboard view. In its basic form, it provides a visual overview of current server activity in graphical form, including:
- Overall number of ongoing client sessions
- Files being uploaded or downloaded
- Data transfer rates and volumes
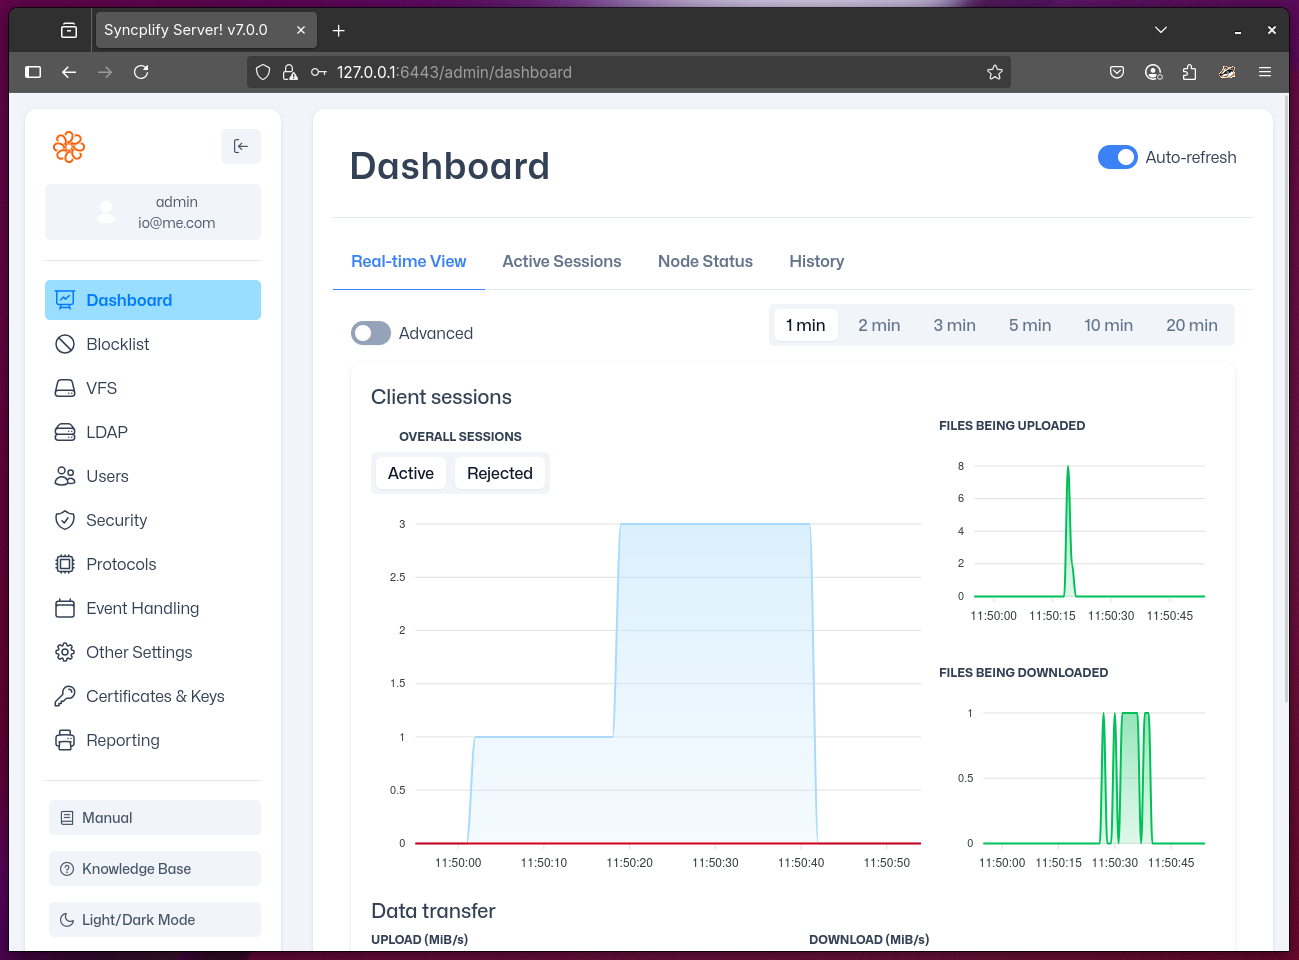
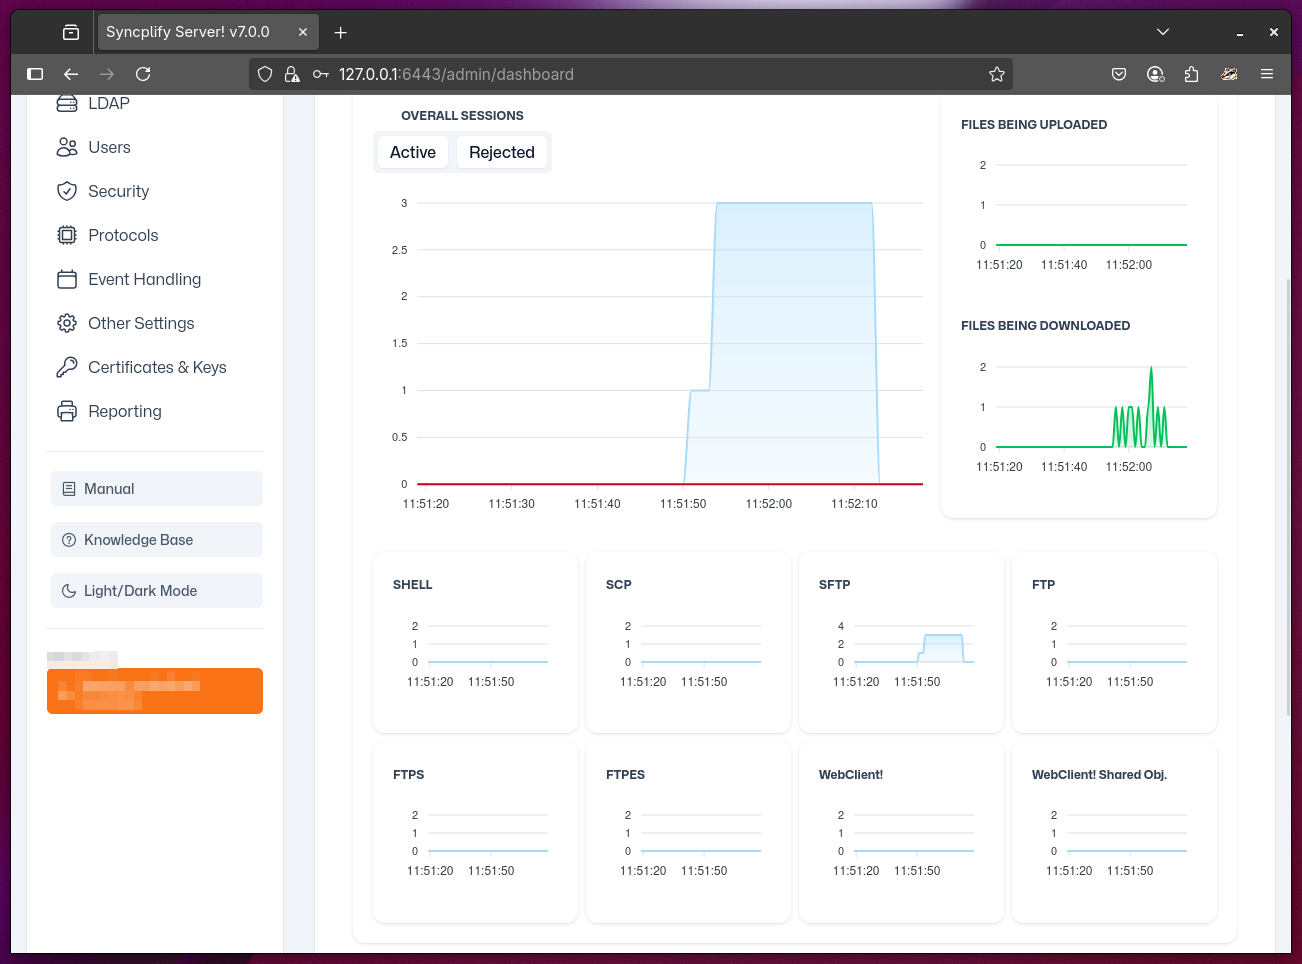
You can expand this view by clicking the "Advanced" toggle in the top-left corner to include per-protocol specific real-time charts, giving you detailed insights into SSH, SFTP, FTP, FTPS, WebClient! (etc.) activity.
The real-time charts automatically refresh every few seconds to provide up-to-the-minute information about your server's performance.
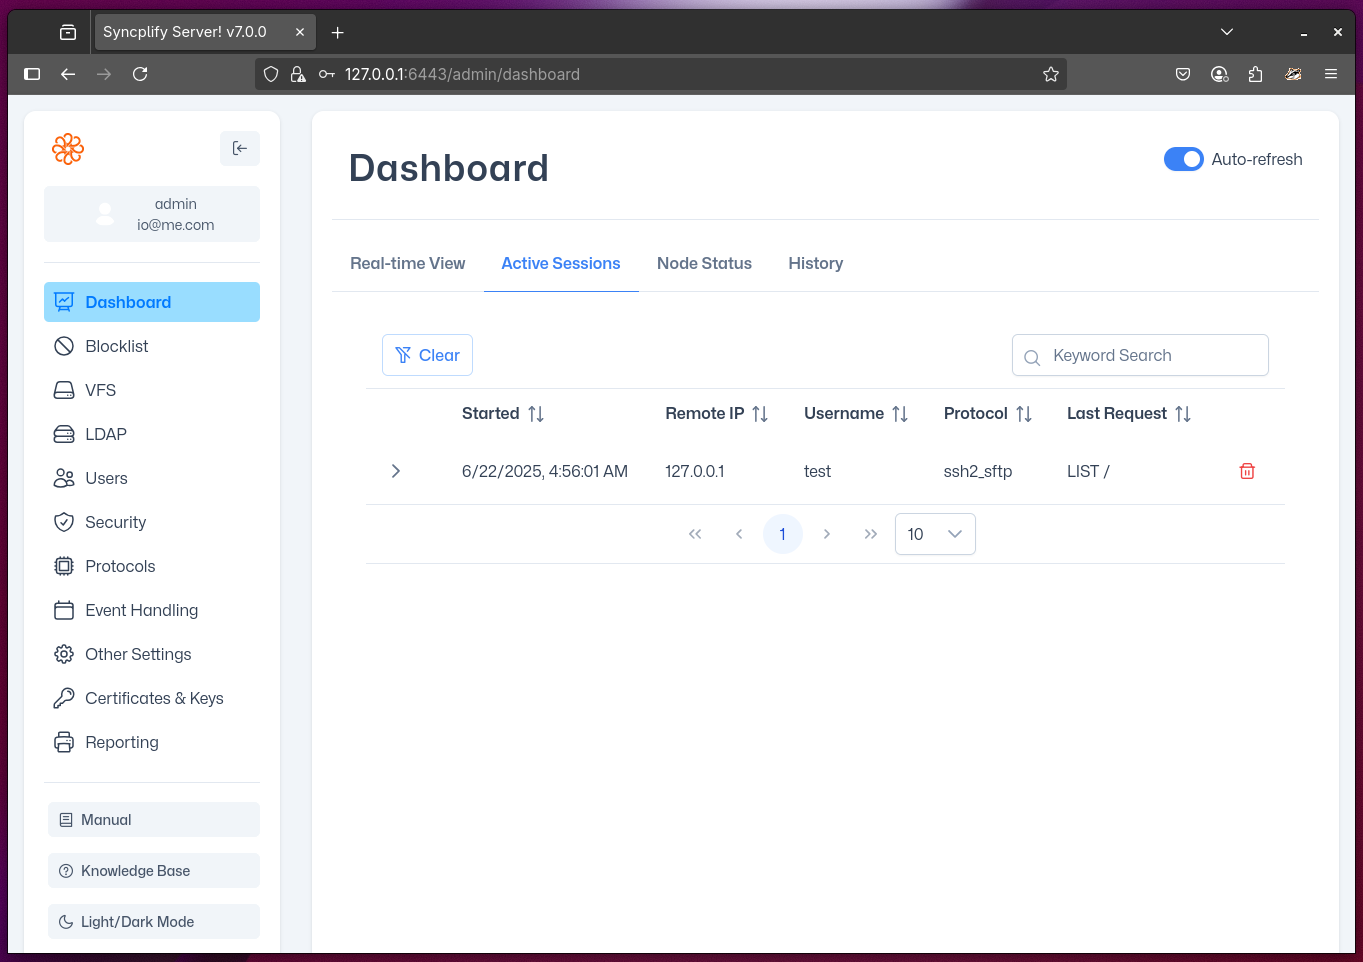
Active Sessions
This section provides a comprehensive overview of all active client sessions currently connected to your server. For each session, you can view:
- Username and protocol being used
- Client IP address and connection time
- Current activity status
From this section, administrators can forcefully terminate any session if necessary, which is useful for managing problematic connections or performing maintenance.
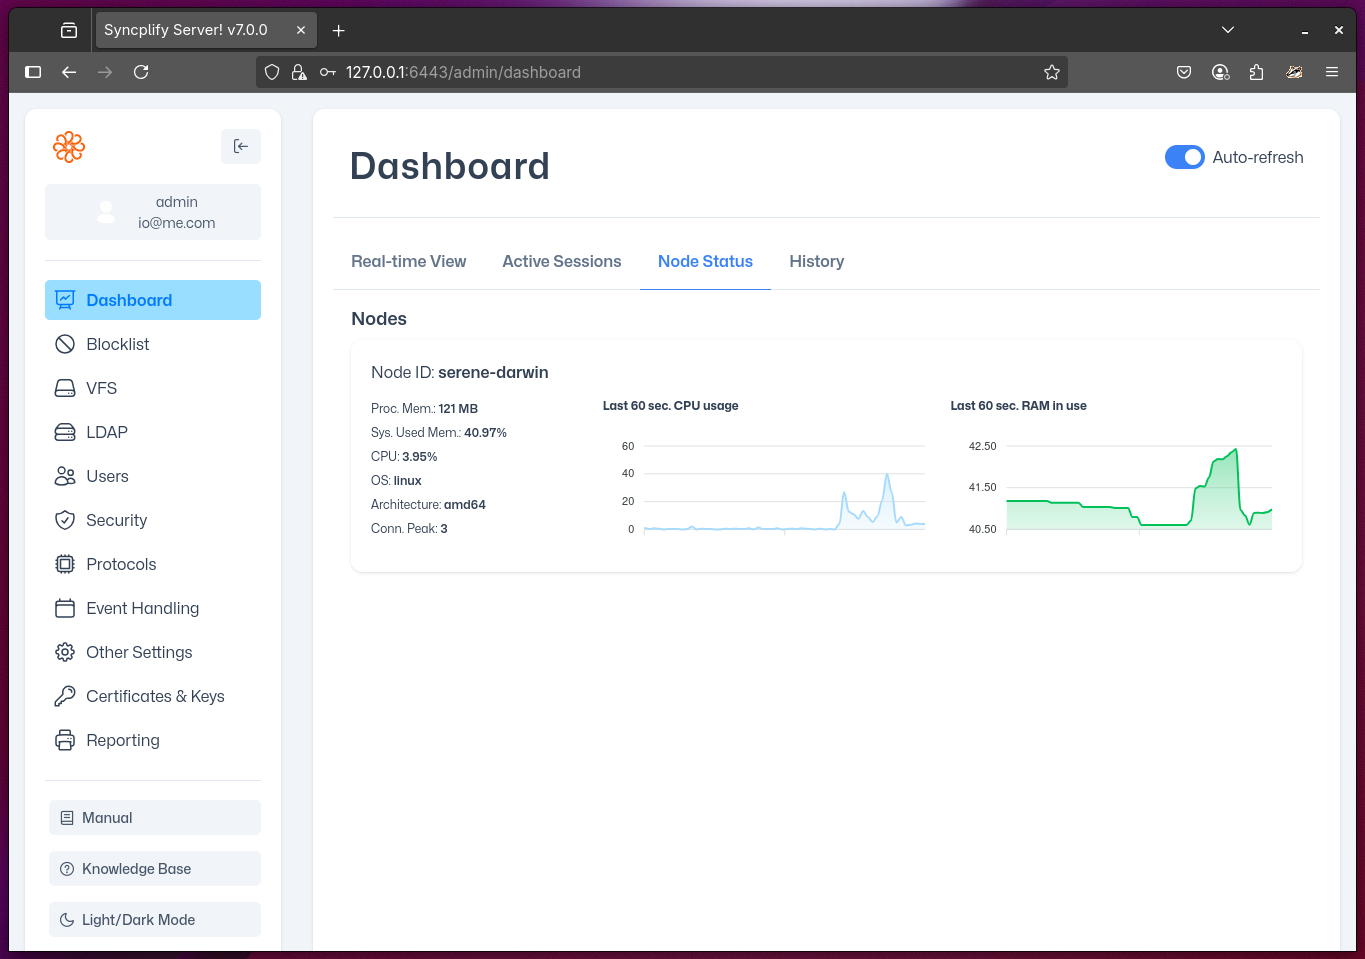
Node Status
This section provides both textual and graphical overviews of the status of each node in your server deployment. The information displayed includes:
- The Node ID
- Memory usage and availability
- CPU utilization statistics
- System architecture and operating system details
This information can be particularly valuable in clustered or high-availability deployments where multiple nodes work together.
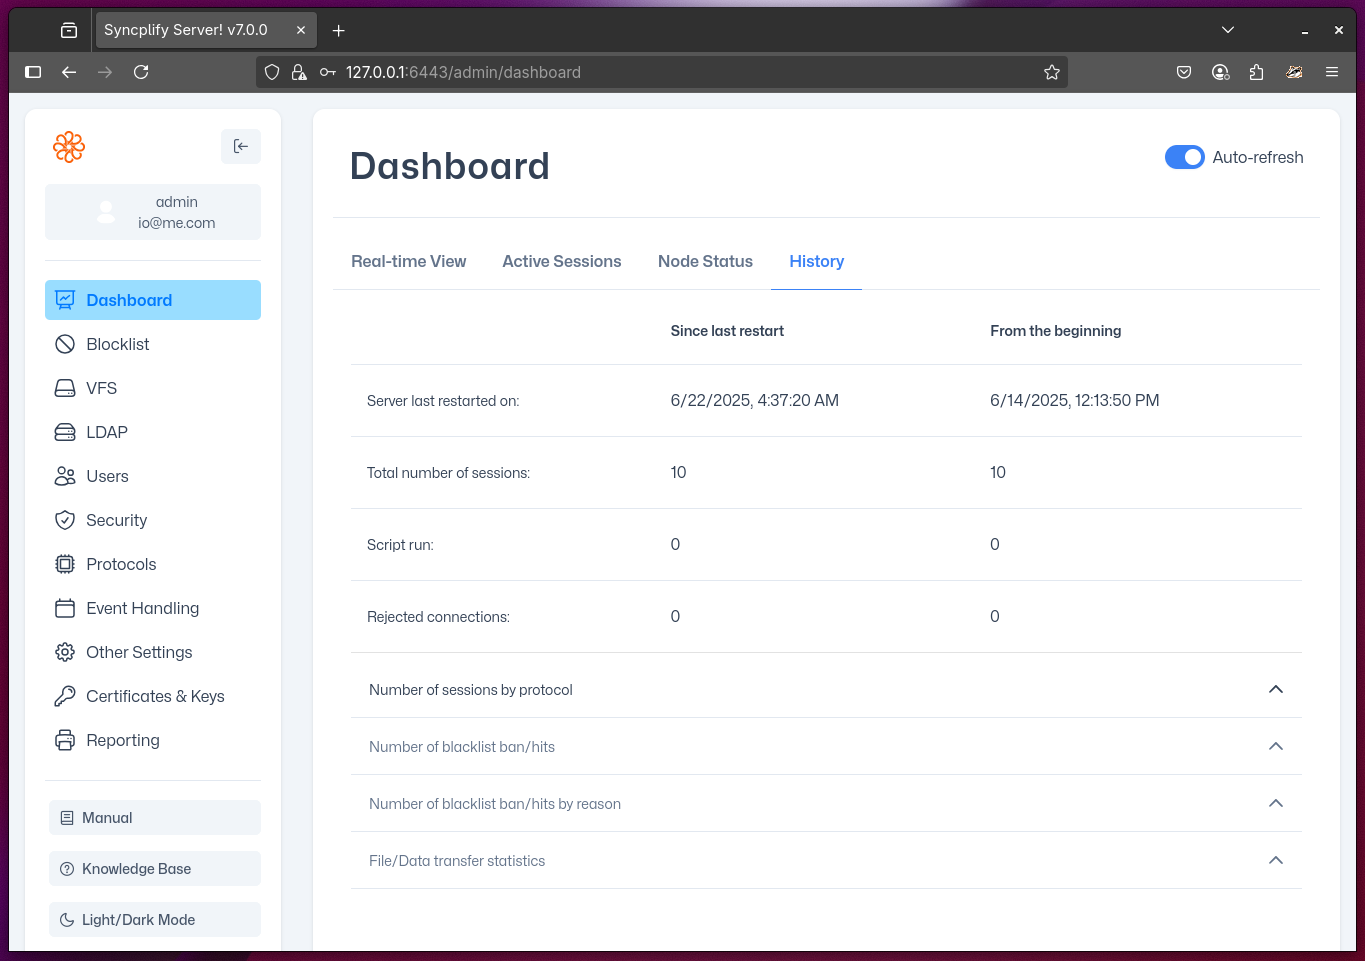
History
This section provides historical information about your server's status and activity, including data fromt he last server restart to the present, and totals from the moment the server was initially deployed.
Dashboard Tips
- The dashboard automatically refreshes to show current information
- Use the Real-Time View's Advanced mode to identify which protocols are experiencing the most activity
- Monitor the Active Sessions section during peak hours to understand user behavior