The dashboard
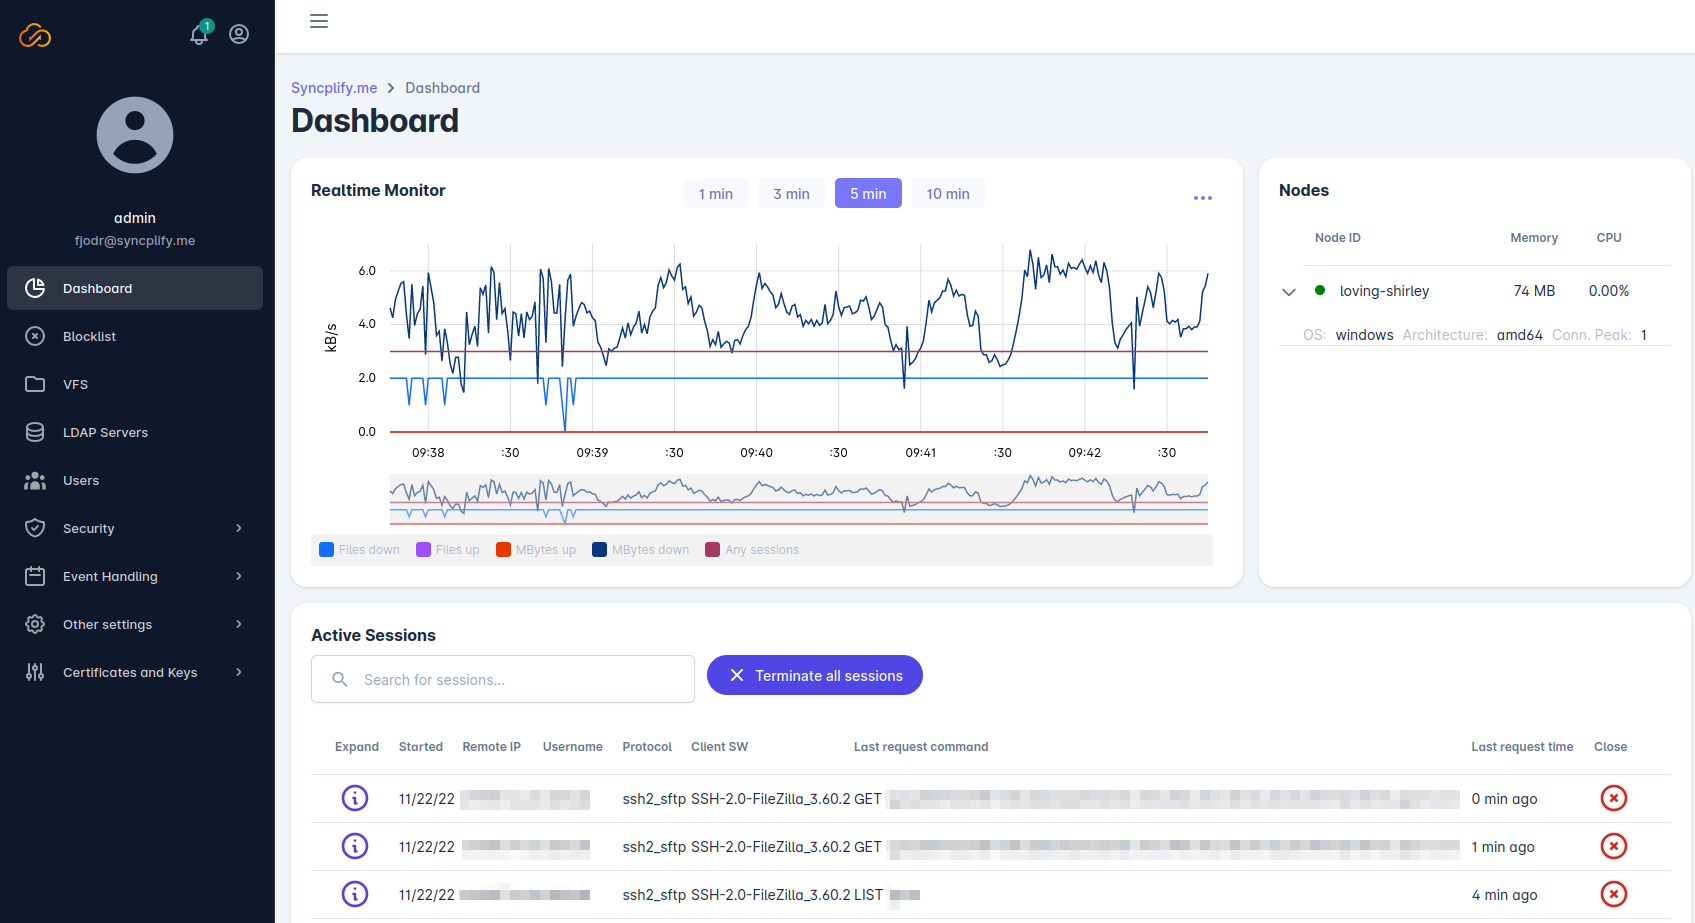
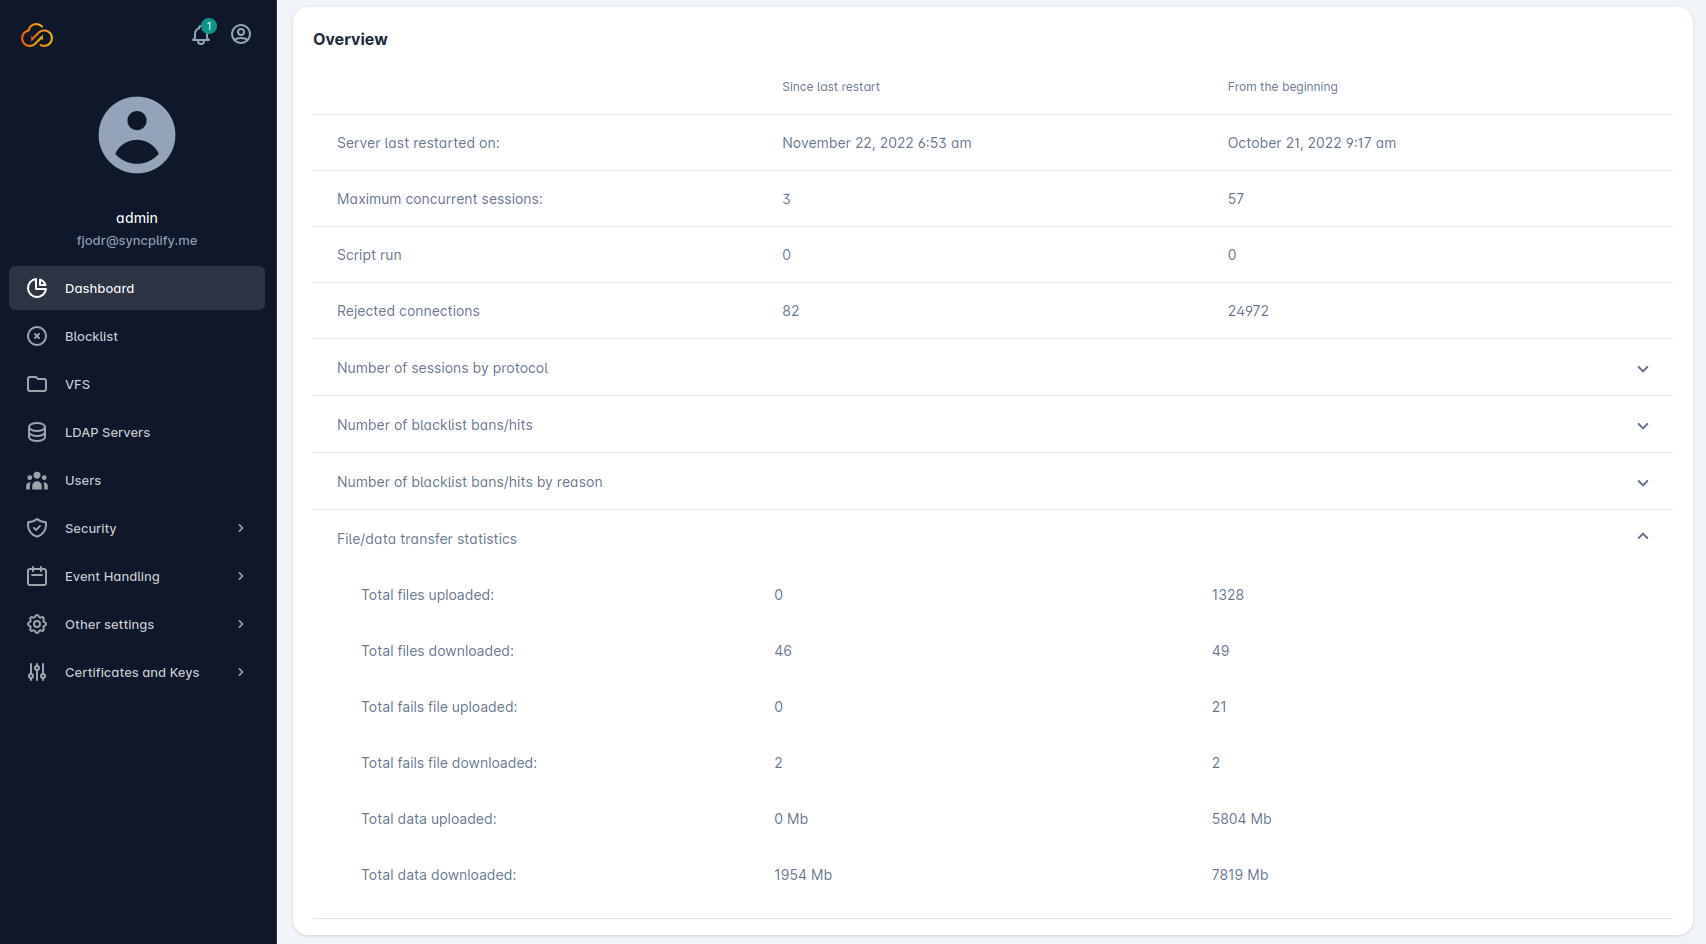
As soon as you log into the Admin UI you're welcomed by the dashboard, which provides a real-time as well as historical overview of your Syncplify Server!'s operation.
The top part of the dashboard contains a real-time configurable chart, some information about the service status, and a table showing all ongoing client sessions.

The lower part of the dashboard shows historical data since the last time the service was restarted, and since the time it was first installed.

